Datadog
Adding a Contact
Datadog integration uses the API Keys feature, available from the Organization Settings ➡️ API Keys section of your Datadog portal.
In Datadog
In the Datadog portal, navigate to the Organization Settings ➡️ API Keys section.
Make sure you have at least one API Key generated. If not, select New Key to generate a new key:
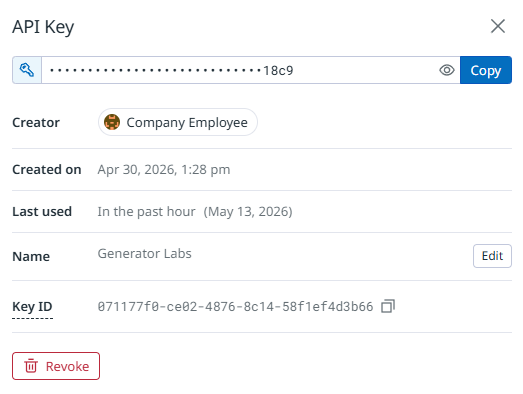
After creating the key, click the Copy button to copy the key to your clipboard.
In the Portal
You can add a new Datadog Contact from the Contacts ➡️ Manage ➡️ Contacts section of the Portal:
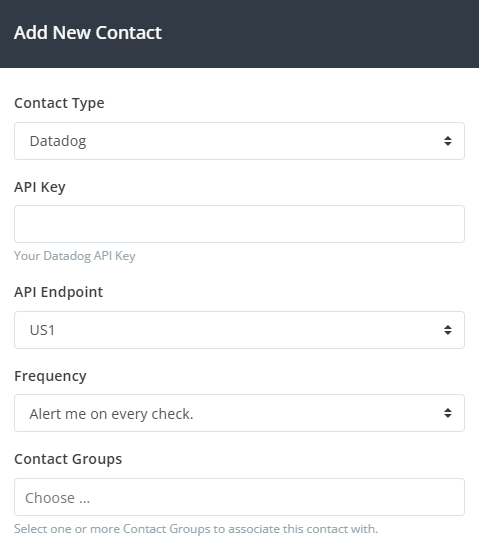
Select Datadog from the Contact Type drop-down, enter the API Key in the API Key field, select your preferred API Endpoint region, select a Frequency, and select one or more Contact Groups to associate with this new contact.
Your Datadog contact is automatically verified against the Datadog API, so your new contact is ready to use right away.
The Frequency setting only applies to RBL Monitoring and will be removed in a future update. Other products such as Certificate Monitoring have their own alerting options.
How It Works
Generator Labs supports two integration modes for Datadog: v2 (the default for new contacts) and v1 (legacy). New contacts are created in v2 mode automatically.
v2 Integration (Default)
The v2 integration sends a structured Event to the Datadog Events v2 API for every notification, and additionally submits Metrics for RBL and Certificate Monitoring alerts so you can graph them, add them to dashboards, and build threshold-based Datadog Monitors.
All events use the alert category, are tagged with source:generatorlabs, endpoint:<region>, severity:<level>, and event_type:<type>, and use the underlying Generator Labs event ID as the aggregation_key so repeated emissions for the same incident group together in the event stream.
For RBL Monitoring, Generator Labs posts:
- An Event summarizing which hosts are currently listed and on which RBLs, with a link to the event detail page. Tagged with the contact-level platform tags aggregated across all hosts in the check.
- Metrics:
generatorlabs.rbl.listed_count: number of currently-listed hosts. Emitted once per host tag, so each listed host contributes to one series for every tag it carries, and filtering bytag:productionin Datadog shows only the listed count for production-tagged hosts. Hosts that carry no tags are counted undertag:untagged.generatorlabs.rbl.total_checked: total number of hosts checked (including clean hosts), tagged with the contact-level aggregated platform tags.
For Certificate Monitoring, Generator Labs posts:
- An Event describing the monitor state with a link to the event detail page. Tagged with
monitor:<name>,host:<host>, and the monitor's platform tags astag:<value>. - Metrics, each tagged with
source:generatorlabs,endpoint:<region>,monitor:<name>,host:<host>, and the monitor'stag:<value>entries:generatorlabs.cert.expiry_days: days until the certificate expires (only emitted when a threshold is crossed or the certificate is renewed)generatorlabs.cert.error_count: number of errors detected; always emitted, including0when the certificate is healthy
Viewing v2 Data in Datadog
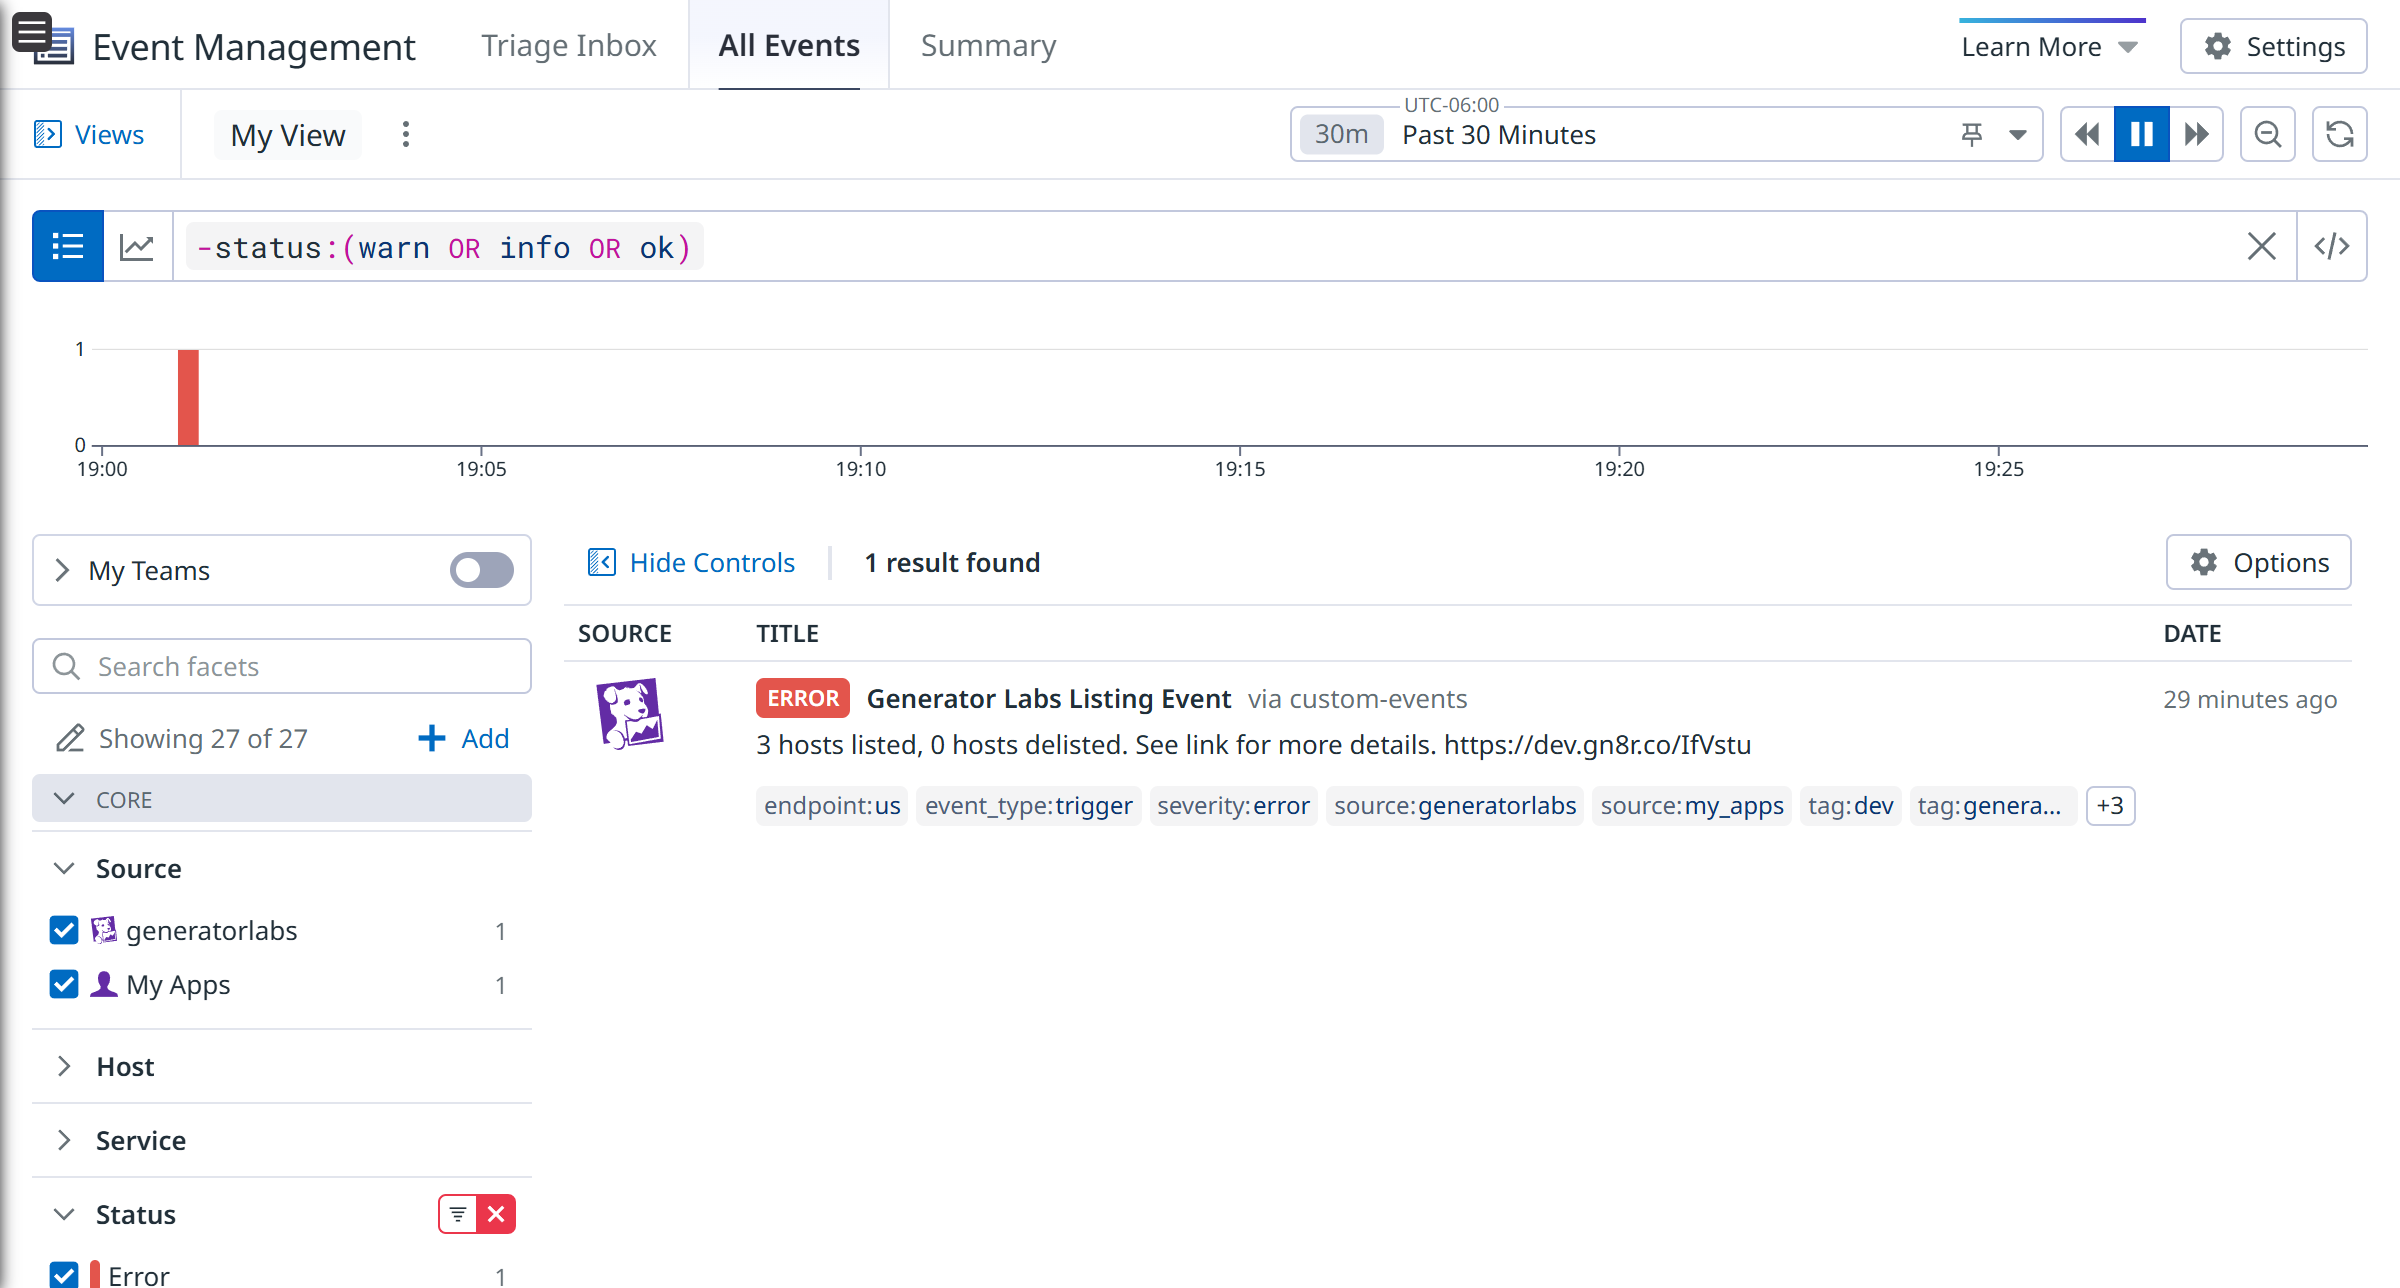
Events are visible in the Events Explorer (Event Management ➡️ Events Explorer, direct URL: app.datadoghq.com/event/explorer). Filter by source:generatorlabs to see only Generator Labs events; filter further by severity:error, event_type:trigger, tag:<value>, etc. to scope by alert state or platform tag.
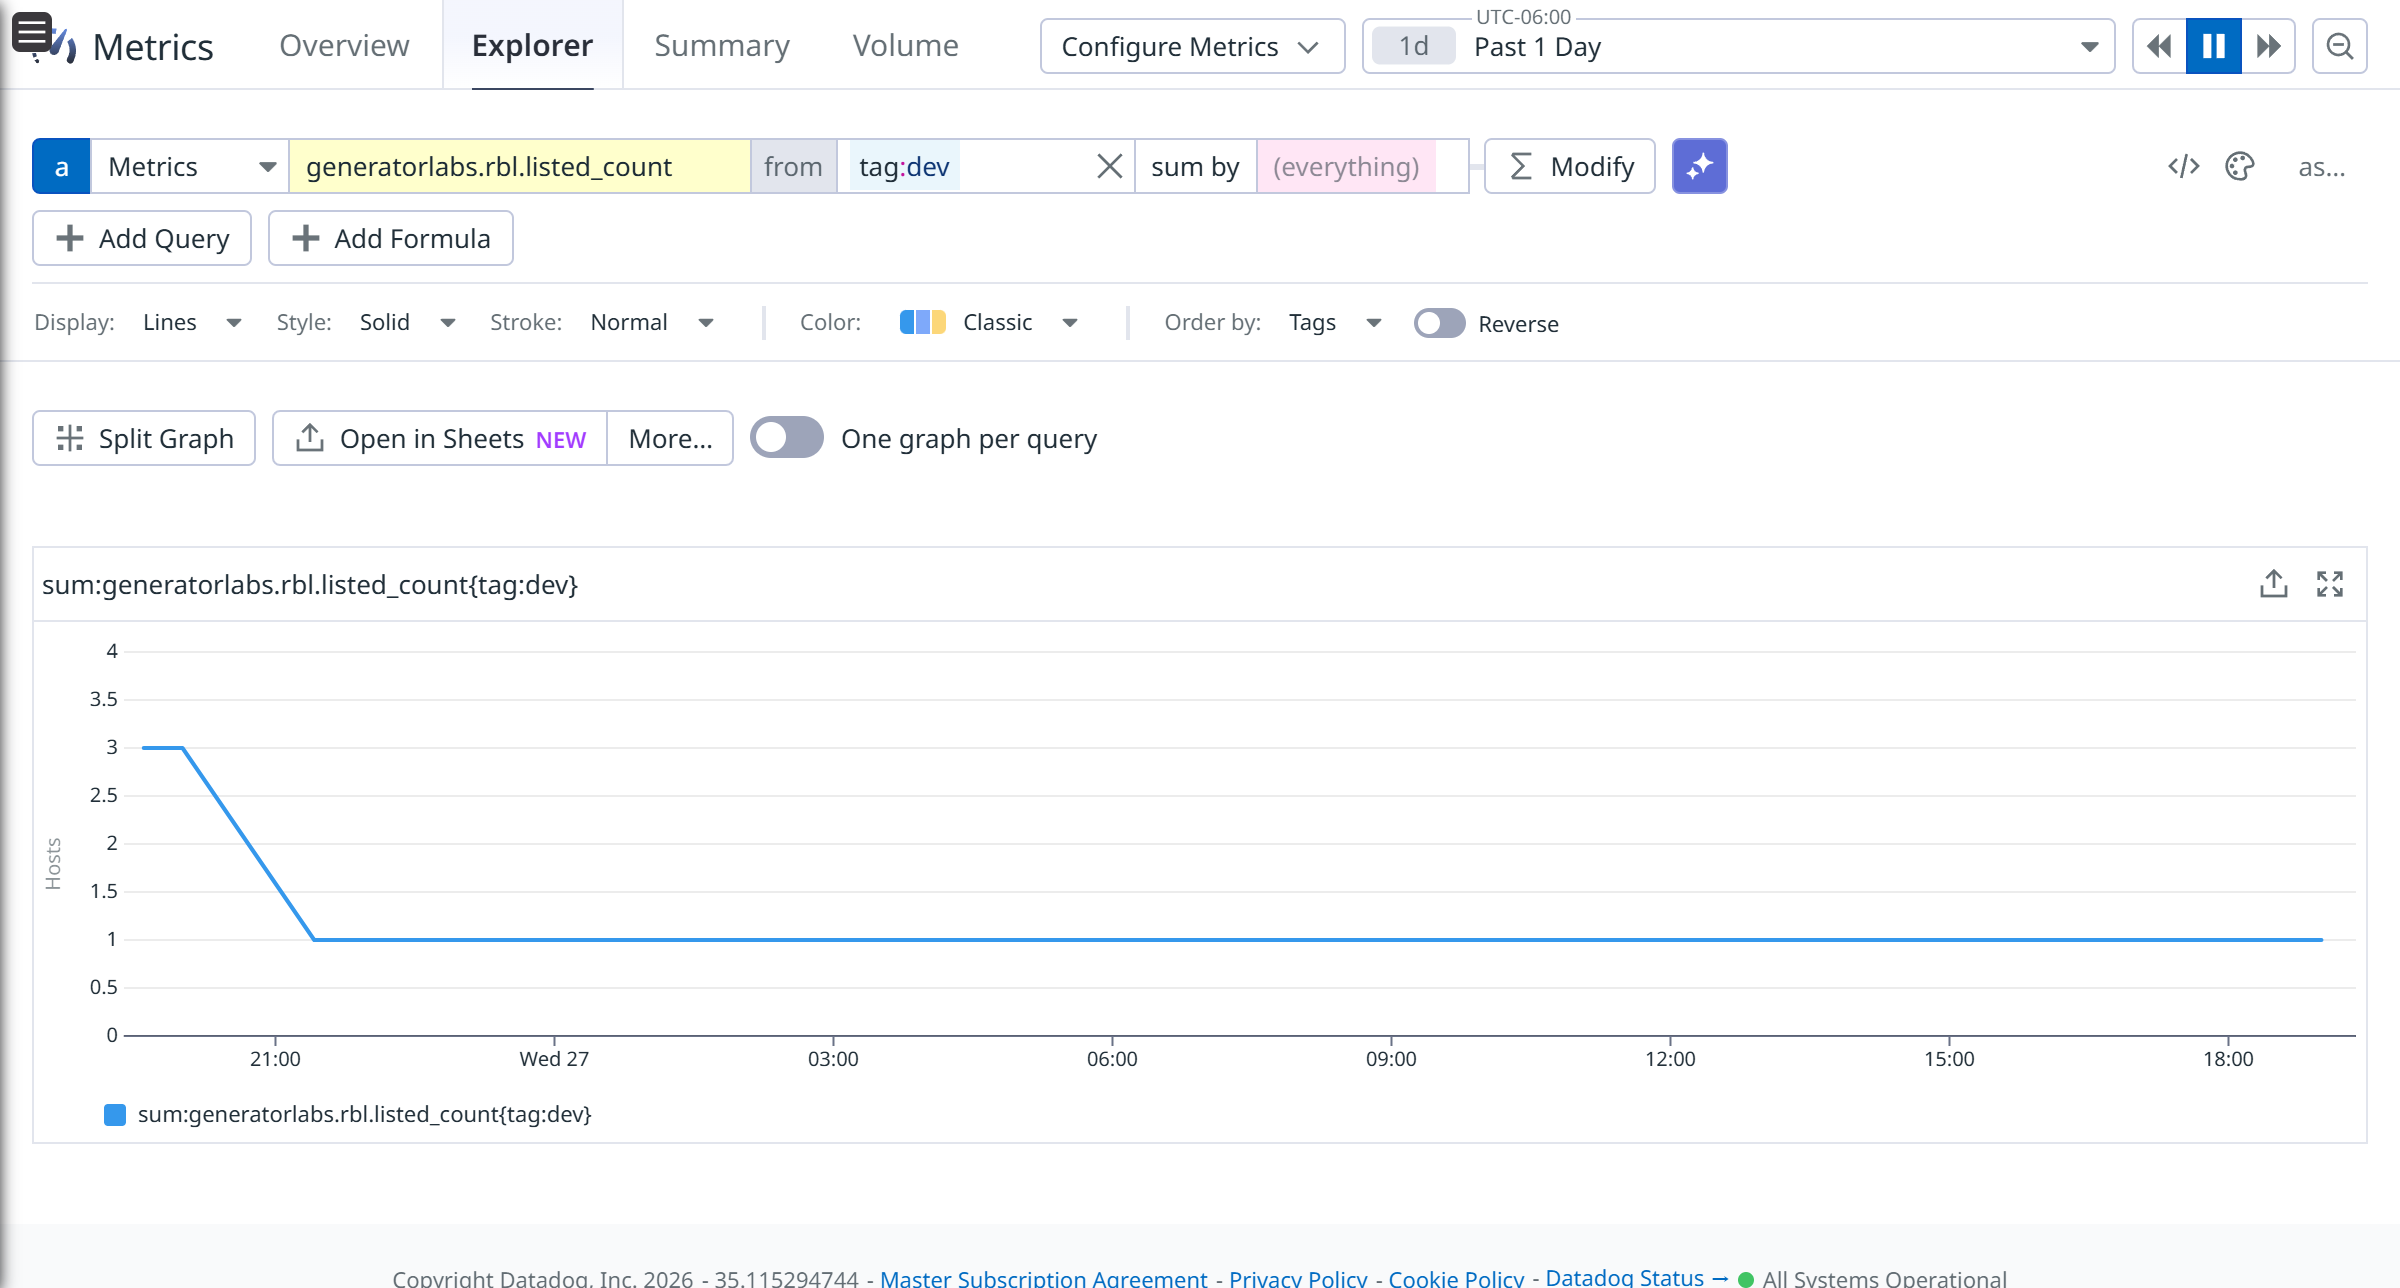
Metrics are available in the Metrics Explorer (Metrics ➡️ Metrics Explorer, direct URL: app.datadoghq.com/metric/explorer). Search for generatorlabs.rbl or generatorlabs.cert to find the metrics. You can graph them, add them to dashboards, or build Datadog Monitors against them: for example, alerting when rbl.listed_count is greater than zero for a specific tag, or when cert.expiry_days drops below a threshold.
Using Platform Tags to Scope Monitors
If you use platform tags in Generator Labs (for example, production, staging, or tags that identify specific business units), those tags are automatically forwarded to Datadog as tag:<value>. This lets you build Datadog Monitors that alert only on a specific subset of your infrastructure.
For RBL alerts, the listed_count metric is fanned out per tag: each listed host contributes one data point to each of its tags. This means you can scope a Datadog Metric Monitor by tag:production and the value you see is the count of listed hosts carrying that tag (no double-counting, no need to combine with sum by or avg by).
For example, if your hosts are tagged production and staging in Generator Labs, you can create two separate Datadog Metric Monitors:
- One watching
generatorlabs.rbl.listed_countscoped totag:production(pages your on-call team) - One watching
generatorlabs.rbl.listed_countscoped totag:staging(posts to a lower-priority channel)
To scope a monitor by tag, set the from filter to the tag value when creating or editing a Datadog Metric Monitor:
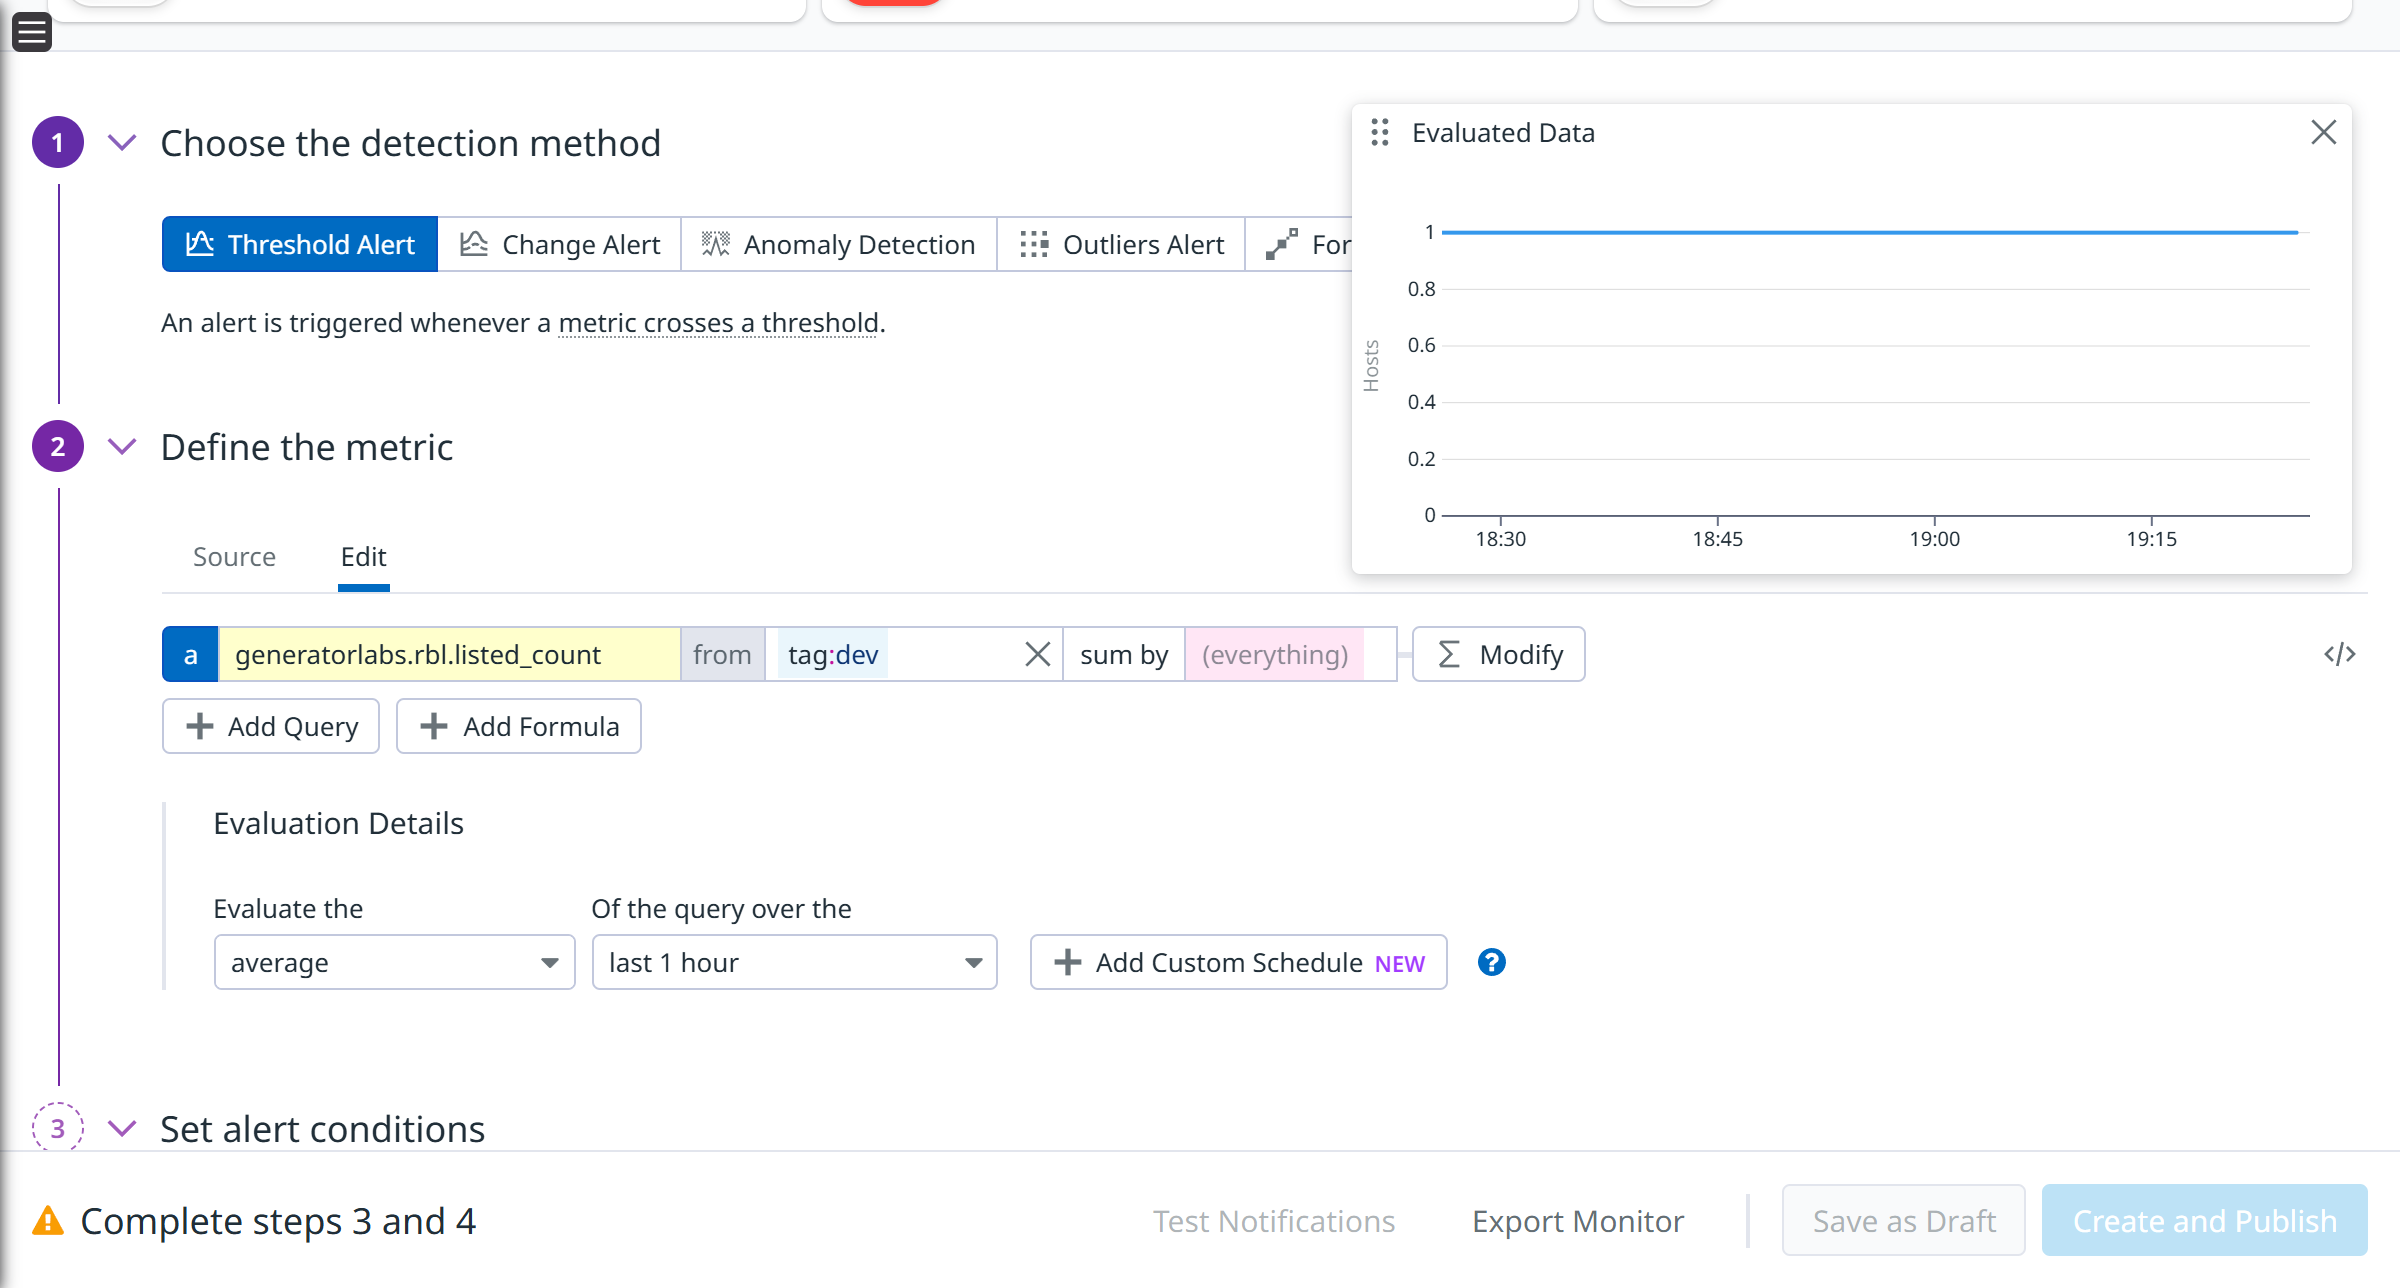
A host with multiple tags is counted under each tag, so summing the per-tag listed_count series across all tags can over-count the actual host total. To get the true unique host total, query generatorlabs.rbl.listed_count filtered by a single tag, or use generatorlabs.rbl.total_checked together with the event data for incident context.
v1 Integration (Legacy)
The v1 integration uses the Datadog Events API for all alert types. Events appear in the Events Explorer with an alert type of error for new alerts, success for resolved alerts, and info for test and confirmation messages.
Viewing v1 Data in Datadog
Events are visible in the Events Explorer (Event Management ➡️ Events Explorer, direct URL: app.datadoghq.com/event/explorer). Filter by source:generatorlabs to see only Generator Labs events. Each event includes:
- Title: A description of the alert (e.g. the monitor or host name)
- Alert type:
error,success, orinfo - Text: The full alert message with a link to the event detail page in the Generator Labs portal
Switching Between v1 and v2
If you originally added your Datadog contact as a v1 contact, you can upgrade it to v2 from the edit sidebar. Contacts added after v2 was introduced are always v2 and cannot be downgraded.
Upgrading to v2
Open the edit sidebar for your Datadog contact. The v2 Integration toggle will be visible:
Enable the v2 Integration toggle and save the contact. Generator Labs will begin sending Service Checks and Metrics for your RBL and Certificate Monitoring alerts.
Rolling Back to v1
If you upgraded from v1 and need to revert, you can turn the v2 Integration toggle off and save. This restores the legacy Events API behavior.
Rolling back is only available for contacts that were originally created as v1 contacts. Contacts created in v2 mode cannot be downgraded.